Market Outlook Newsletter 3rd Quarter 2024
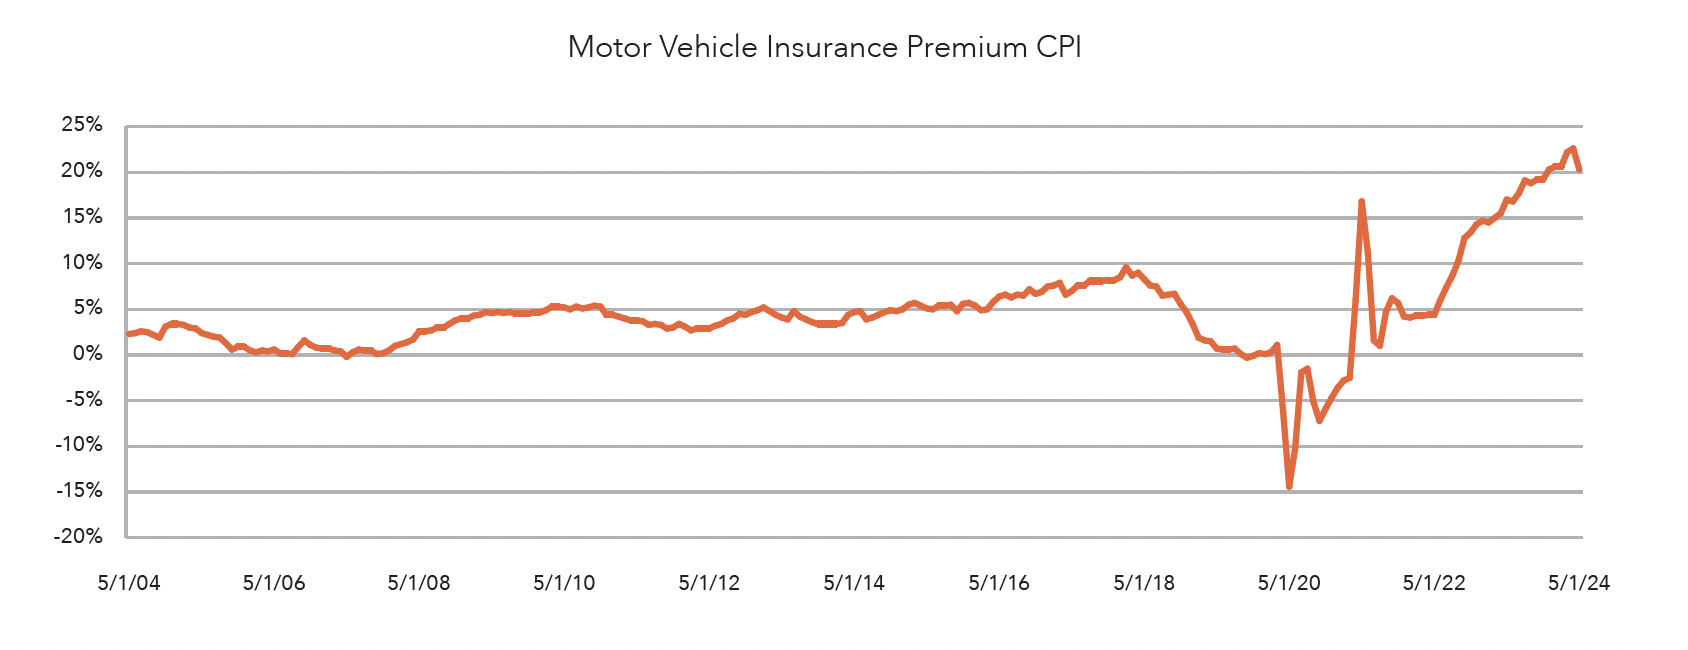
Insurance premiums have experienced annual price increases of over 20%, creating more negative sentiment among American consumers.
Rising insurance premiums and higher interest rates have negatively impacted the average American consumer. However, overall measures of inflation are slowly moving lower. Since 2021, inflation has been one of the most closely monitored economic indicators. Although there was an initial belief that the elevated inflation levels were temporary and would normalize as supply chain issues improved and energy prices normalized, inflation has taken longer than the Federal Reserve (Fed) expected to approach its 2.0% annual target. While prices of some goods and services return to normal levels, inflation has surged in other areas of the economy, most recently in motor vehicle insurance.
Since September 2022, the US consumer has experienced double-digit year-over-year growth in auto insurance premiums paid (see chart). Peaking at 22.6% in April, it has fallen slightly but remains well above the 20-year average of 4.7%. Even though auto insurance makes up only about 3% of the total Consumer Price Index (CPI), it contributed over 0.5% of the 3.3% year-over-year CPI increase through May, accounting for around 15% of the annual increase. The primary driver of inflation continues to be the shelter component of the CPI index, which represents 36% of the index and contributes 1.9% to the 3.3% year-over-year increase.
Several factors, such as the policyholder’s age, coverage location, driving history, type of insured vehicle, and associated repair costs, influence insurance premiums. The cost of repairs has increased as vehicles have incorporated new technologies and more computerized systems. Additionally, supply chain disruptions and part backorders (namely semiconductor chips) have led to a low 3 20% year-over-year growth in vehicle maintenance and repair costs in 2022, which remained high at 11% as of May 2024. Auto insurance premiums are not alone as homeowners insurance premiums rose by 23% from January 2023 to February 2024.

The bottom line is many Americans are feeling the weight of increased premiums. Insurance premiums are less tangible than higher prices on consumer goods and are often perceived as sunk costs without a tangible benefit.
Despite overall inflation levels remaining above the Fed’s 2.0% target, the general trend is moving lower. The year-over-year measure of CPI in May was 3.3%, significantly lower than the 9.1% peak in June 2022 and the 4.0% level in May 2023. Falling prices in sectors such as used cars offset higher prices in categories like auto insurance. If the longer-term trend in inflation remains lower, it may create room for an interest rate cut later this year.
With tight credit spreads, now is not the time to take too much risk within fixed income.
Our team’s active approach to managing our fixed income allocation has produced a defensive tilt. We expect the economic road ahead to be a little bumpier and do not see as much value in the more credit-sensitive segments of the bond market.
Our investment team takes the approach that the fixed income allocation within a diversified portfolio is there for a mix of stability and diversification from equities. There is no need to reach for yield with an outsized allocation to more credit-sensitive bond market segments, such as investment-grade corporate bonds. This is especially true when credit spreads are tight, such as now. This happens when the yield of corporate bonds is not much higher than risk-free US
Treasury bonds of similar maturities.
By optimally structuring the fixed income allocation, we are looking to have:
To help highlight this impact, the chart below shows the monthly returns of BBB-rated corporate bonds (Bloomberg Baa Corporate Bond Index) relative to monthly returns of US Treasury bonds (Bloomberg US Treasury Index) over the past 20 years. There were two time periods with equity market drawdowns of 30% or more. One was during the global financial crisis from 2007 to early 2009. Notice the difference in monthly returns of the corporate bond index relative to US Treasuries during that time. In October 2008, the corporate bond index highlighted was down 11.0%, while the US Treasury index was down 0.1%. A more recent example is from March 2020, when the corporate bond index was down 10.1% while the US Treasury index was up 2.9% at a time when the S&P 500 Index was down around 35%.

Our team does not currently anticipate a large equity drawdown in the near term; however, our goal is to be positioned in a prudent way before those risks are priced into the financial markets.
While the current positioning within fixed income is more defensive, our investment team continually monitors various segments of the bond market to look for areas of opportunity. This allows us to tilt the allocation into areas of the market that are historically undervalued and away from areas of the market that are historically overvalued. As of the end of Q2, we remain overweight into mortgage-backed securities (MBS) and underweight to traditional corporate bonds.
One of the key data points we monitor is the credit spread of various types of fixed income assets. The credit spread measures the yield of the bonds above risk-free US Treasuries of similar maturities. When those spreads are historically high, they price in the potential credit risk from defaults and can typically be a good value. Other times, such as today, those credit spreads are low and price in a low probability of defaults.
When going one step further to analyze the impact on performance, the chart below helps highlight the correlation of credit spreads and resulting returns over the following 12 months using the same Bloomberg Baa Corporate Bond Index highlighted in the previous section. The left section of the chart shows periods when credit spreads are historically tight, while the right side highlights when credit spreads are historically wide. This helps demonstrate the impact of credit spreads on future return opportunities. For a point of reference, the current average credit spread for BBB-rated corporate bonds at the end of June is 1.14%, which is near historically tight levels.
While we are tilted more defensively within the fixed income allocation, our team still sees pockets of opportunity where we overweight to generate yield. The result is a weighted average yield-to-maturity (YTM) of the funds used within the fixed income allocation of around 5.2% as of June. That compares to the Bloomberg US Aggregate Bond Index, which has a YTM of around 5.0%.

By Daniel Zeigler, CFP®, CMFC® and Jake Stapleton
The Artificial Intelligence (AI) frenzy pushes Nvidia to all-time highs, fueling a continued rally in the S&P 500 Index.
The consensus outlook for equities remains optimistic for the year, based on expectations of a resurgence of corporate earnings in the year’s second half. However, we expect increased volatility due to seasonality and uncertainty as the election nears.
The recent trend of mega-cap equities leading the S&P 500 Index higher continued in Q2, but one name specifically stood out: Nvidia (NVDA). In the first half of the year, Nvidia delivered nearly a 150% total return, while the S&P 500 Index had a year-to-date return of 15.3%. Nvidia’s weight within the S&P 500 Index has more than doubled since the beginning of the year, increasing from 3.1% to 6.6%.
The excitement around AI has kept Nvidia in the spotlight, drawing investors seeking higher-return securities. Despite restrictions on chip exports, the company has consistently reported strong earnings and revenue growth, which continues to attract investors.
While there’s no firm indication that Nvidia’s growth will slow, analysts anticipate that earnings growth may begin to normalize in the coming quarters as other companies catch up to the mega-cap names that have benefited from the AI-fueled rally.
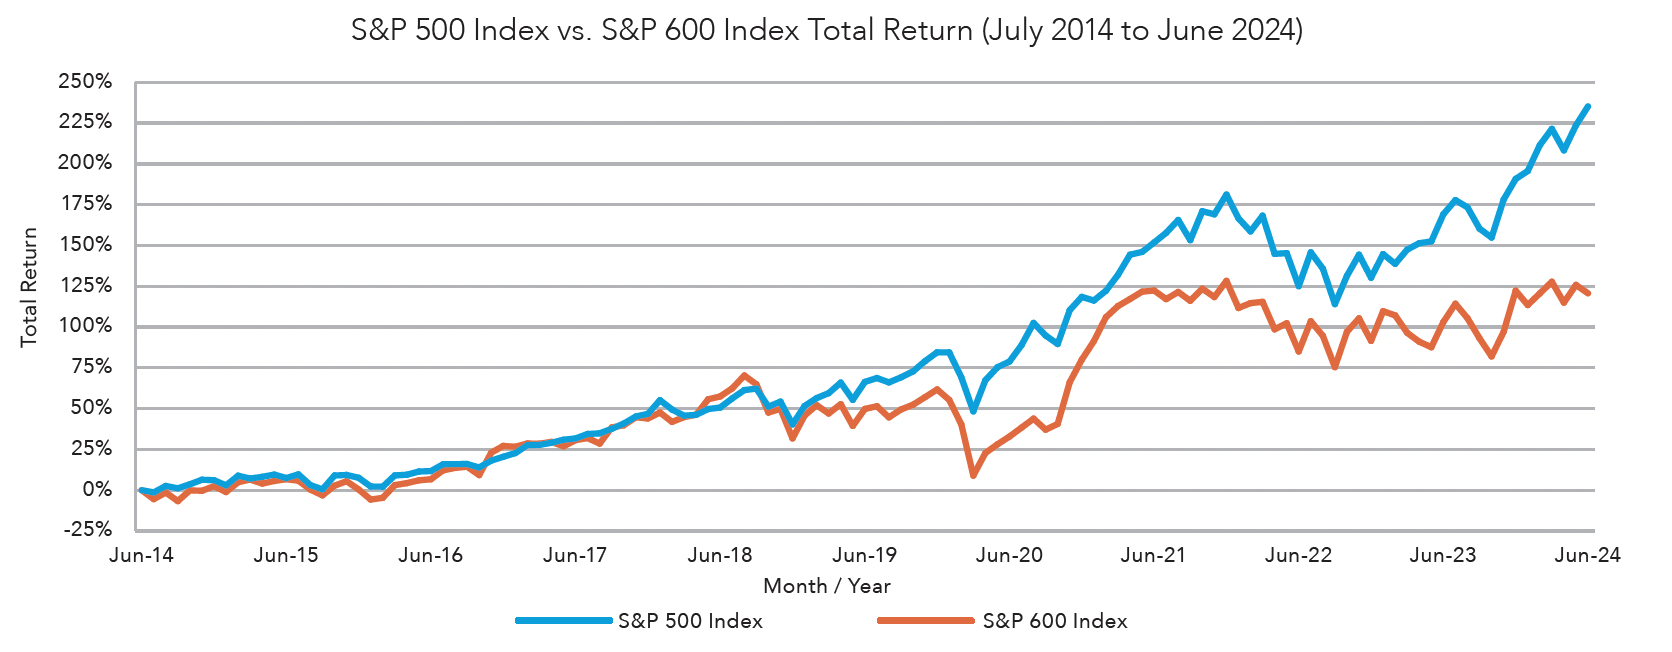
Much like the underperformance of the S&P 500 Index outside of the top 10 mega-cap positions, the performance gap between the S&P 500 Index and the S&P 600 Index, which represents US small-cap equities, has continued to widen. The most recent times that small-cap equities outperformed large-cap equities were in late 2020 following COVID-19 vaccine news and from late 2016 to mid-2018, as lower corporate tax rates provided a more significant boost to earnings of small-cap companies relative to large-cap companies. While the recent underperformance of small caps is not unprecedented, it is unusual and worth understanding the drivers of this performance gap.

For one, small-cap companies generally have higher debt than their large-cap counterparts. They carry anywhere from 20-30% more debt on their balance sheets. With the Fed combating inflation with elevated interest rates, small-cap companies are paying more to service that debt.
Second, the S&P 500 holds more than double the weight of technology stocks than its small-cap equivalent. Large-cap performance has been dominated by tech names like Nvidia, Microsoft, and Apple, with the S&P Info Tech Index posting 18% in year-to-date returns. In contrast, the largest sectors for the small-cap index are financials and industrials, which are not keeping up with the continued rally in technology stocks.
There are a few ways for small-cap stocks to compensate for some of the recent underperformance. One would be a selloff of the AI-fueled rally that has significantly impacted the S&P 500 while small-cap stocks hold up better. Alternatively, continued economic growth and lower interest rates could allow small-cap equities to play catch-up while the bull market continues. Although it is too early to predict the catalyst, this is a trend that we continue to watch closely for an eventual reversal.
With election day approaching, investors worldwide are cautiously awaiting the outcome. We have received several inquiries about what to expect from the financial markets leading up to and following the election.
Due to numerous unknown variables, it is difficult to predict the outcome of most presidential elections. Instead of focusing solely on which political party wins, it is more beneficial to understand the advantages of staying invested regardless of the election results. We align our clients’ positions with long-term objectives and goals, so an election year should not cause significant deviations from that plan.

There is a perception that volatility increases substantially around the time of the election. While data supports this notion, some of the increased volatility is due to seasonality. Looking at the CBOE Volatility Index (VIX), the average level of the volatility index over the past 30 years has been around 19.0. July (average VIX level of 18.0) was the month with the least volatility. In contrast, the months with the highest volatility have been October (average VIX level of 21.8) and November (average VIX level of 20.7). This seasonal pattern of higher volatility around the time of US elections might give the impression that election results have a greater impact on the market than they actually do.
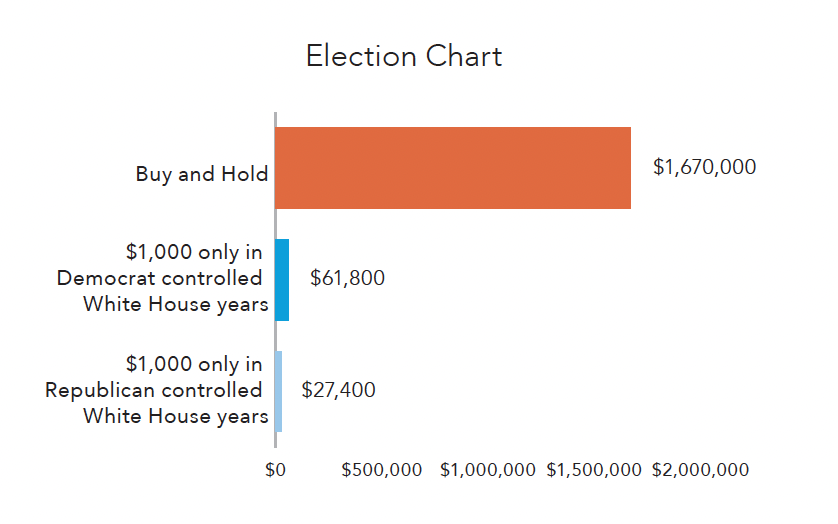
To better understand portfolio returns, let’s compare the differences between a $1,000 investment during Republican and Democrat presidencies since the 1950s. If an investor had invested $1,000 in the S&P 500 Index only when a Republican was in office, that investment would be worth $27,400. Conversely, if they had only invested when a Democrat was in office, that amount would be worth $61,800. However, if the investor had invested the same amount and adhered to a strict buy-and-hold strategy, that investment would now be worth nearly $1.7 million. Allowing political beliefs to overshadow long-term goals and objectives can result in significant costs to the investor.
Our team of dedicated professionals are here to support you.